
By Brandon Norris
Gold Neared $5,600 and Silver Topped $121: How Record Precious Metal Prices Are Reshaping Coin Values
The Metal Underneath the Coin
Published June 12, 2026. Metal prices and sale results are as reported at the time by the sources named below; melt values are our own arithmetic.
In January 2026, precious metals hit record highs. Gold came close to $5,600 per ounce in late January, as reported by CBS News, and spot silver reached an all-time nominal record of $121.60 per ounce on January 29, as reported by Reuters — far above its 1980 high of about $50. Both have since fallen back a long way: a June 8, 2026 market report from Skillings Mining Intelligence put spot gold near $4,330 and silver near $68. The effects on coin collecting are still working through the market.
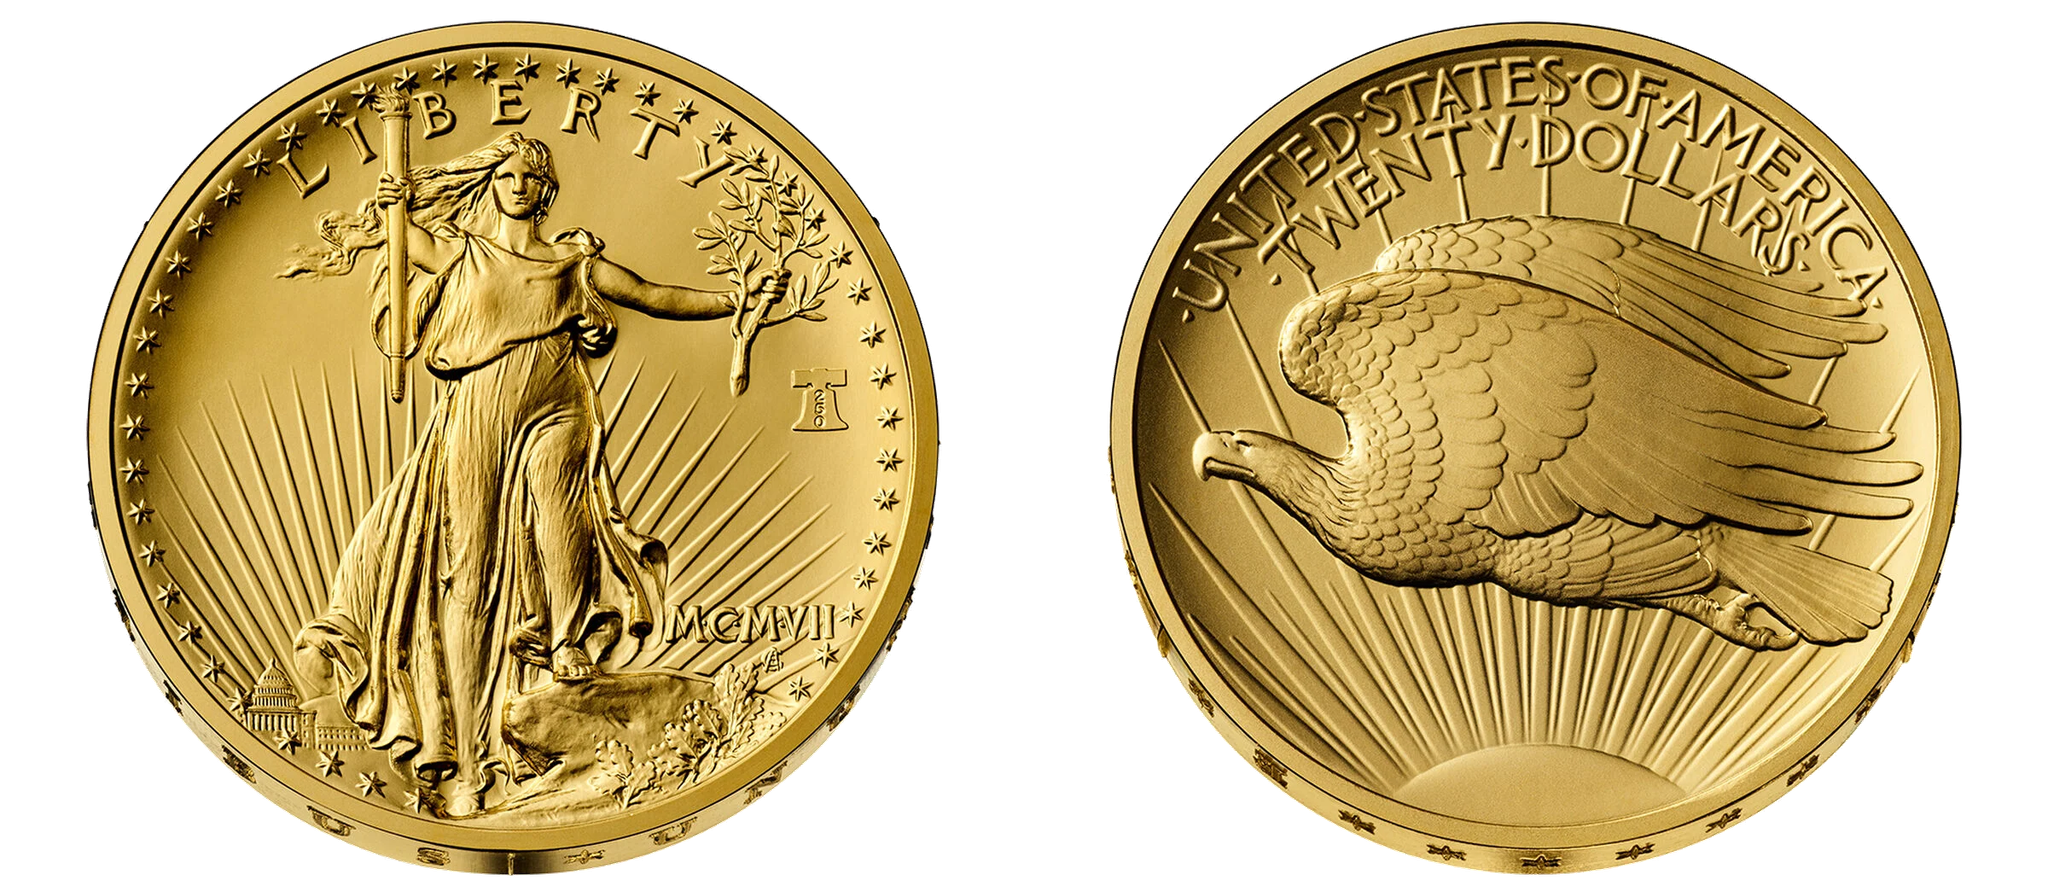
The Saint-Gaudens Double Eagle — containing nearly a full ounce of gold. View in the NumisDex catalog.
What Happened to Silver
Silver's climb was steep. Reuters reported on December 31, 2025 that silver was up more than 150% for the year, and by January 29, 2026 it had reached $121.60, driven by industrial demand (solar panels, AI infrastructure, electronics), investment demand, and persistent supply deficits. Then it crashed. On January 30, Reuters reported, it gave up more than 25% in a single day.
Even at early June's price of roughly $68 per ounce, silver remains well above its long-run range. For context, Reuters noted that before silver crossed $35 in June 2025, it had stayed below that level for over 13 years.
How Metal Prices Affect Coin Values
Every coin containing gold or silver has two value components: numismatic premium (collector value based on rarity, grade, and demand) and melt value (the intrinsic value of the precious metal). The relationship between these two components varies dramatically. The melt figures below use round prices close to early-June levels, $67 silver and $4,300 gold:
| Coin Type | Metal Content | Melt Value |
|---|---|---|
| Common-date Morgan Dollar | 0.7734 oz silver | ~$51.82 (@ $67 silver) |
| Key-date Morgan (e.g., 1893-S) | 0.7734 oz silver | ~$51.82 (@ $67 silver) |
| Common $20 Liberty Gold | 0.9675 oz gold | ~$4,160 (@ $4,300 gold) |
| Key-date $20 Gold (e.g., 1927-D) | 0.9675 oz gold | ~$4,160 (@ $4,300 gold) |
For common-date coins, melt value is now most of what the coin is worth. For key dates and rarities, it is a small part of the price: in January 2025, Heritage sold a 1927-D double eagle graded PCGS MS-65+ CAC for $3,840,000, more than 900 times its gold value at $4,300.
Who Benefits and Who Doesn't
- Sellers of common silver benefit. A circulated common-date Morgan dollar holds about $52 of silver at $67 an ounce, against about $23 at $30 silver.
- Buyers of common silver pay more — but they're getting proportional metal value. The numismatic premium on common dates has actually compressed.
- Rare coin values are less affected. When a coin's price rests on rarity, a swing of a few dozen dollars in its metal value barely registers.
- Bullion collectors benefit directly. American Silver Eagles, Gold Eagles, and modern bullion coins track metal prices closely.
The Drivers Behind the Rally
- Central bank gold purchases: Market analysts, CME Group among them, cite strong central bank demand for gold
- Industrial silver demand: Solar panel production, AI data center buildouts, and electronics manufacturing add to a market that the Silver Institute says has been in deficit, with demand above supply, for five straight years through 2025
- Geopolitical uncertainty: Trade tensions, sanctions, and currency instability drive demand for hard assets
- Inflation hedging: Both metals are traditional stores of value during inflationary periods
Explore Morgan Dollars, Walking Liberty Half Dollars, and American Silver Eagles in the NumisDex catalog.